Contact us

10 Best Waste Water RO Systems for Global Buyers?

Choosing a reliable Waste Water Ro System is not a simple equipment purchase. It is a decision involving water quality, operating costs, maintenance access, and discharge responsibilities. Global buyers often compare capacity first, yet recovery rate and pretreatment can determine long-term performance. A system rated for 100 cubic meters daily may fail early if oil, suspended solids, or scaling minerals reach its membranes.

Professor Menachem Elimelech, a leading membrane-science expert, has said, “Water scarcity is one of the greatest challenges facing humanity.” His statement gives this comparison a wider purpose. A well-designed Waste Water RO System can recover valuable process water, reduce freshwater demand, and support more responsible industrial operations. However, no machine solves every site problem. Some suppliers emphasize impressive recovery percentages while hiding energy consumption, cleaning frequency, or replacement costs. That deserves careful questioning.

This guide examines ten Waste Water RO System options for global buyers. It considers membrane configuration, pretreatment requirements, automation, energy use, material quality, after-sales support, and regional serviceability. Practical details matter. Can technicians replace a cartridge filter quickly? Are pressure gauges easy to read? Does the control panel support local voltage standards? These small points affect daily reliability.

There is room for doubt. Product data may look precise, but field conditions rarely remain perfect. Feedwater changes. Operators make mistakes. Spare parts arrive late. Therefore, this review focuses on evidence, not marketing language, while recognizing that the “best” system depends on each facility’s wastewater profile, budget, and compliance needs.
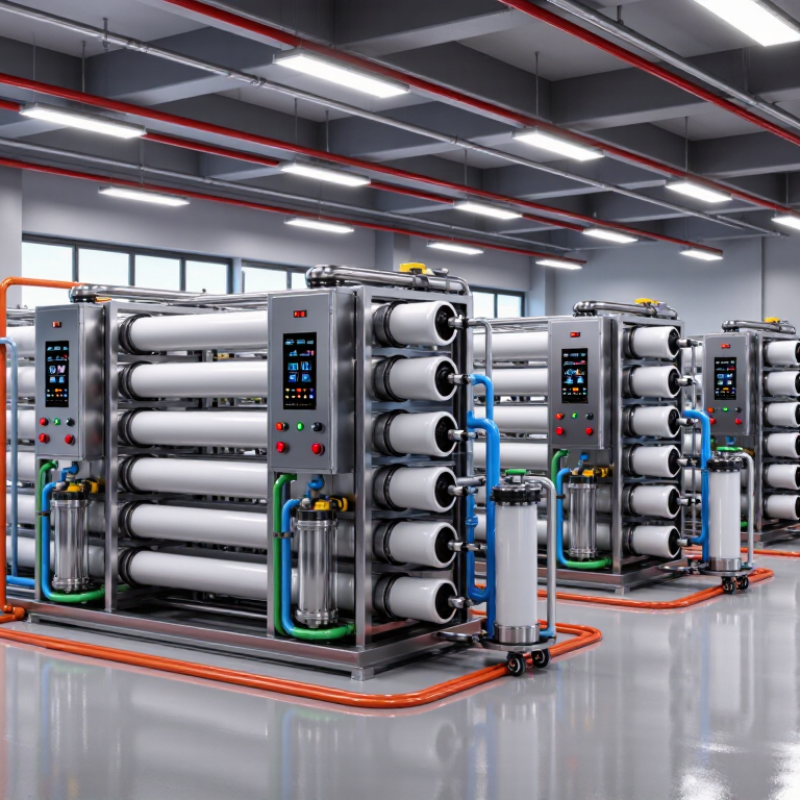
10 Best Waste Water RO Systems for Global Buyers?

Define Wastewater RO Performance: 95–99.8% Salt Rejection and 50–85% Recovery

For global buyers, the best wastewater RO systems should prove performance under real feed conditions. Salt rejection of 95–99.8% is a useful benchmark, but it is not a universal guarantee. Engineers calculate rejection from feed and permeate conductivity, using stable testing procedures. Recovery usually ranges from 50–85%, depending on salinity, temperature, fouling risk, and discharge limits. Higher recovery saves water, yet it can increase scaling pressure and cleaning frequency.

AWWA Manual M46 identifies pretreatment, crossflow control, and concentrate management as major RO design factors. The US EPA Water Reuse Action Plan also recognizes membrane treatment as an important advanced barrier for water reuse. Meanwhile, the UNESCO World Water Development Report 2017 reported that more than 80% of global wastewater was released without treatment. That figure explains the demand, but it does not make every RO application simple. Industrial wastewater may contain oils, silica, solvents, or changing organic loads. One number can hide a difficult plant.

Tips: Ask suppliers for verified salt rejection, recovery, permeate flow, and feedwater data. Request a pilot test when wastewater changes seasonally. Check cleaning records, membrane replacement intervals, energy use, and concentrate plans. A claimed 99.8% rejection may fall sharply after fouling. That deserves scrutiny. Also compare performance at the actual design temperature, not only at laboratory conditions.

Compare the 10 Best RO Systems by 0.5–2.5 kWh/m³ Energy Use

When global buyers compare the 10 best wastewater RO systems, energy use must be measured under equal conditions. The practical range is 0.5–2.5 kWh/m³. Lower figures often suit low-salinity wastewater with stable feed quality. Higher consumption may result from high pressure, fouling, or difficult industrial streams. Request test data, recovery rate, feed pressure, and permeate quality. A number without operating conditions is weak evidence. I would not trust a brochure alone.

A reliable comparison should examine pretreatment, membrane loading, pump efficiency, and cleaning frequency. Sediment filters and proper chemical control can reduce pressure loss. Variable-frequency pumps may lower energy during changing flow demand. However, energy savings can disappear when operators ignore scaling or poor cartridge replacement. A system using 1.0 kWh/m³ in a factory test may reach 1.8 kWh/m³ onsite. Feed temperature matters too. Cold water increases membrane pressure requirements. The cheapest purchase is not always the lowest-cost choice.

Tips: Ask for a 72-hour pilot test using your actual wastewater. Record electricity, flow, recovery, conductivity, and cleaning events. Compare usable permeate, not only rated capacity. Leave space for maintenance access. Small details matter.

10 Best Wastewater RO Systems for Global Buyers

Comparison of representative energy consumption levels from 0.5 to 2.5 kWh/m³

How to read this chart: Lower specific energy consumption generally indicates lower operating costs, provided that the system still meets the required permeate quality, recovery rate, fouling control, and pretreatment conditions. The values shown are representative benchmark figures for common wastewater RO configurations and may vary with feedwater salinity, temperature, membrane age, recovery, and pressure.

Energy intensity is expressed as kilowatt-hours per cubic metre of treated feedwater (kWh/m³).

Assess Pretreatment, Fouling Control, and 15–30 bar Operating Pressure

Wastewater RO selection starts before the membrane.

UN-Water’s 2024 SDG 6 Synthesis Report found that only 56% of domestic wastewater flows were safely treated in 2022. Feed quality can change hourly, even in a well-managed plant.

A practical pretreatment train may include screening, equalization, coagulation, multimedia filtration, and cartridge filtration. Measure turbidity, SDI, hardness, silica, oil, and residual disinfectant.

The World Bank’s Quality Unknown report noted that roughly 80% of wastewater returns to the environment without adequate treatment. That figure makes fouling control more than a maintenance issue.

For low-to-moderate salinity effluent, 15–30 bar can be a workable RO range. Pressure alone is not proof of performance. A clean membrane may operate near 15 bar, while rising osmotic pressure or scaling may push operation toward 30 bar.

Track normalized permeate flow and salt passage weekly. Clean when trends justify it, not only after production collapses.

Antiscalant selection needs jar testing and compatibility checks. Biological fouling is less visible. A slight odor, rising differential pressure, or unstable flux may be the early warning.

I would not trust a single laboratory sample. Real wastewater is inconsistent. Pilot testing remains expensive, but skipping it can create a costly surprise.

Industry guidance from the Water Environment Federation and membrane-focused EPA reuse guidance both emphasize feed characterization, monitoring, and staged treatment.

Rank Global RO Systems by Capacity, Certifications, Warranty, and Total Cost

For global buyers, the 10 best wastewater RO systems should be ranked by verified performance, not brochure claims. Capacity comes first: measure treated water in cubic meters per day under real feed conditions. A system rated at 100 m³ daily may deliver less when salinity, temperature, or suspended solids rise. Smaller systems can be more consistent.

Certification adds trust. Check NSF/ANSI 58 where applicable, electrical safety approval for the destination market, and an ISO 9001 quality system. These documents should match the exact model and factory, not a related product. Request test reports and serial-number records. A useful warranty covers membranes, pumps, controls, and workmanship separately. Read exclusions carefully. Some warranties look strong but exclude fouling.

Total cost changes the ranking. Include pretreatment, membrane replacement, electricity, chemicals, labor, shipping, installation, and reject-water handling. A low purchase price can become expensive after two years. In field evaluations, I would compare energy use per cubic meter and record downtime, not only output. Ask for references with similar water chemistry. Claims can be optimistic.

My ranking would favor systems with stable recovery, accessible spare parts, clear manuals, and responsive technical support. Capacity still matters, but oversized equipment may waste energy and occupy valuable space. Smaller units may need frequent cleaning. That trade-off is easy to miss. Buyer assumptions should be tested with a pilot run, although pilots add time and cost. Something can still go wrong.

Select the Best Wastewater RO System for Regional Water Standards and Reuse Goals

Selecting the best wastewater RO system starts with regional water standards and the intended reuse application. A system suitable for industrial cooling may not meet irrigation or process-water requirements. Measure the water first. Test TDS, hardness, silica, COD, oil, suspended solids, and microbial indicators before comparing equipment.

Local discharge rules also influence the design. Some regions restrict concentrate disposal, while others require documented recovery rates and continuous monitoring. Pretreatment may include screening, clarification, carbon filtration, ultrafiltration, or chemical dosing. Without proper pretreatment, membranes foul quickly and cleaning costs rise. This is where field experience matters. A laboratory report alone cannot show seasonal changes, temperature shifts, or sudden production losses.

Reuse goals should guide recovery, automation, and maintenance access. Food processing may require stronger hygiene controls. Textile facilities may need stable permeate quality during variable loads. Remote sites benefit from simple controls, spare parts, and clear alarm systems. Choose sensors that track pressure, conductivity, flow, and cleaning intervals. Do not select the highest recovery rate automatically. It can increase scaling risk and reduce membrane life. A smaller, well-monitored system may perform better than an oversized unit. I would not promise perfect results from one water test. Pilot trials and operator feedback often reveal problems that specifications miss. Permits, operator training, and reliable after-sales support also deserve careful review.

10 Best Waste Water RO Systems for Global Buyers? - Select the Best Wastewater RO System for Regional Water Standards and Reuse Goals

Comparative guide to common wastewater reverse osmosis configurations, design ranges, regional reuse objectives, and key selection criteria.

Typical design comparison for industrial and municipal wastewater RO applications
No. System configuration Typical feed source Feed TDS range
(mg/L)
Typical recovery Permeate TDS
(mg/L, typical)
Practical capacity range Recommended pretreatment Best-fit reuse goal Regional standards or checks Main selection note
01 Low-salinity tertiary RO Municipal secondary effluent after biological treatment 500–2,000 70–85% 20–150 10–1,000 m³/day Fine screening, multimedia or membrane filtration, cartridge filtration, dechlorination Cooling makeup, toilet flushing, irrigation, process water Local reclaimed-water limits; microbial disinfection; nutrient and turbidity requirements A cost-effective option when biological treatment already controls organic loading.
02 Industrial process-water RO Food, beverage, pharmaceutical, and general manufacturing wastewater 1,000–5,000 65–80% 30–300 5–500 m³/day Oil separation where required, coagulation, clarification, cartridge filtration, antiscalant Wash water, utility water, cooling circuits, non-product contact use Discharge permit, sector-specific contaminants, chemical oxygen demand, oil, and metals Feed variability should be confirmed through composite sampling rather than a single grab sample.
03 High-recovery two-pass RO Treated industrial effluent requiring low conductivity water 1,000–4,000 80–90% overall 5–80 10–1,000 m³/day Advanced filtration, precise pH control, antiscalant, dechlorination, degassing as needed Boiler makeup after polishing, high-grade process water, rinse water Conductivity, silica, boron, hardness, microbiological control, and end-use specifications Higher recovery reduces reject volume but increases scaling risk and control complexity.
04 Textile wastewater RO Dyeing, printing, washing, and finishing effluent 1,500–8,000 60–80% 50–500 10–500 m³/day Color removal, biological treatment, ultrafiltration, cartridge filters, antiscalant Dye-bath reuse, washing, cooling, and non-potable plant applications Color, surfactants, COD, toxicity, salinity, and local industrial discharge limits Membrane fouling control is critical because dyes, polymers, and surfactants can accumulate quickly.
05 Landfill leachate RO Landfill leachate after equalization and solids removal 3,000–20,000+ 50–75% 50–500 5–300 m³/day Equalization, ammonia control, biological treatment, ultrafiltration, cartridge filtration Permit-compliant discharge or controlled concentrate management Ammonia, PFAS where regulated, metals, organics, chloride, and hazardous-waste rules The concentrate-management plan is as important as the permeate quality.
06 Food and beverage wastewater RO High-organic wastewater from food and beverage processing 800–4,000 65–85% 20–200 10–1,000 m³/day DAF or clarification, biological treatment, ultrafiltration, cartridge filtration, sanitary cleaning Cleaning, cooling, utilities, and other non-product-contact operations Hygiene rules, water-contact classification, COD/BOD, nutrients, and local reuse regulations Sanitary design and validated cleaning procedures are essential for reliable operation.
07 Mining and high-TDS wastewater RO Mine water, process water, and tailings-related wastewater 3,000–30,000 45–75% 50–500 20–2,000 m³/day Clarification, media filtration, iron and manganese removal, cartridge filtration, antiscalant Dust suppression, process reuse, controlled discharge, and water recovery Metals, sulfate, acidity, selenium, boron, salinity, and watershed-specific permits High-pressure equipment and robust solids handling may be required for difficult feeds.
08 Seawater-influenced wastewater RO Coastal municipal or industrial wastewater with saltwater intrusion 5,000–40,000 35–60% 100–800 50–5,000 m³/day High-quality clarification, ultrafiltration, cartridge filtration, dechlorination, scale control Industrial reuse, irrigation where salinity permits, and non-potable municipal reuse Chloride, sodium adsorption ratio, boron, marine discharge, and local reclaimed-water limits Use seawater-grade high-pressure design only when the feed salinity requires it.
09 Zero-liquid-discharge RO front end Industrial wastewater where liquid discharge is restricted 2,000–50,000 60–85% before concentration 20–300 10–1,000 m³/day Custom chemical treatment, clarification, ultrafiltration, cartridge filtration, antiscalant Maximum water recovery followed by brine concentrator or crystallizer Local discharge prohibition, hazardous-waste classification, salt disposal, and energy requirements RO alone is not zero liquid discharge; downstream concentration and solids handling are necessary.
10 Potable-reuse advanced treatment train Highly treated municipal wastewater for indirect or direct potable reuse 500–2,000 75–85% 5–100 100–20,000 m³/day Microfiltration or ultrafiltration, RO, UV, advanced oxidation, activated carbon where required Potable supply after regulatory approval and a validated multi-barrier treatment scheme National drinking-water rules, pathogen controls, trace-organic monitoring, and risk-management plans The complete treatment train—not RO alone—must satisfy potable-reuse regulations.
Important design note: The figures above are representative engineering ranges, not guaranteed performance values. Actual results depend on temperature, pH, hardness, silica, oil, suspended solids, organic loading, microbiology, membrane selection, operating pressure, and pretreatment quality. Final sizing and compliance should be based on laboratory analysis, pilot testing, local regulations, and the intended reuse application.